
CrewAI Built-in Tracing
CrewAI provides built-in tracing capabilities that allow you to monitor and debug your Crews and Flows in real-time. This guide demonstrates how to enable tracing for both Crews and Flows using CrewAI’s integrated observability platform.What is CrewAI Tracing? CrewAI’s built-in tracing provides comprehensive observability for your AI agents, including agent decisions, task execution timelines, tool usage, and LLM calls - all accessible through the CrewAI AMP platform. Tracing is managed independently from telemetry.
Prerequisites
Before you can use CrewAI tracing, you need:- CrewAI AMP Account: Sign up for a free account at app.crewai.com
- CLI Authentication: Use the CrewAI CLI to authenticate your local environment
Setup Instructions
Step 1: Create Your CrewAI AMP Account
Visit app.crewai.com and create your free account. This will give you access to the CrewAI AMP platform where you can view traces, metrics, and manage your crews.Step 2: Install CrewAI CLI and Authenticate
If you haven’t already, install CrewAI with the CLI tools:- Open your browser to the authentication page
- Prompt you to enter a device code
- Authenticate your local environment with your CrewAI AMP account
- Enable tracing capabilities for your local development
Step 3: Enable Tracing in Your Crew
You can enable tracing for your Crew by setting thetracing parameter to True:
Step 4: Enable Tracing in Your Flow
Similarly, you can enable tracing for CrewAI Flows:Step 5: View Traces in the CrewAI AMP Dashboard
Traces are uploaded only after a successful authenticated export or an explicitly approved anonymous upload. A run whose local buffer is discarded has no uploaded trace. For traces associated with your account, open the Traces tab in the CrewAI AMP dashboard to view agent interactions, tool usage, and LLM calls.
Alternative: Environment Variable Configuration
You can also enable tracing globally by setting an environment variable:.env file:
tracing=True.
Viewing traces after your first run
The first time you run a Crew or Flow, an interactive terminal may ask:crewai traces enable or crewai traces disable, or by setting tracing
on the Crew or Flow.
Local buffering and authenticated export
First-run trace collection stays in process memory until you agree to share, even if you have saved login credentials. Unauthenticated tracing uses the same consent flow. Before consent, CrewAI requests no upload grant and sends no execution spans. The buffer retains up to 1,000 spans and 8 MiB of encoded OTLP data. SetCREWAI_EPHEMERAL_TRACE_MAX_SPANS and
CREWAI_EPHEMERAL_TRACE_MAX_BYTES to positive integers to adjust these limits.
Overflow drops the oldest spans; a span larger than the byte limit is dropped.
The buffer is cleared after sharing or discarding it.
When tracing is enabled and credentials are available, CrewAI exchanges your
CLI login, CREWAI_USER_PAT, or platform integration credential with AMP for
an execution-specific grant. It then exports OpenTelemetry spans directly to
Wharf using that grant. Invalid credentials do not fall back to anonymous upload.
Hosted execution sessions
Hosts can wrap execution withtelemetry_session from
crewai.telemetry.tracing. The session uses CrewAI lifecycle events to create
and finish spans, preserving their timestamps, parent relationships, and HITL
pause/resume links. Pass an existing provider with providers= to retain the
host’s tracer and logging integration. Pass span processors with processors=
and a host logging callback with log_emitter=. The host owns any redaction
in these integrations.
Each session owns its tracing lifecycle and leaves the application’s global
OpenTelemetry provider unchanged.
Viewing Your Traces
Access the CrewAI AMP Dashboard
- Visit app.crewai.com and log in to your account
- Navigate to your project dashboard
- Click on the Traces tab to view execution details
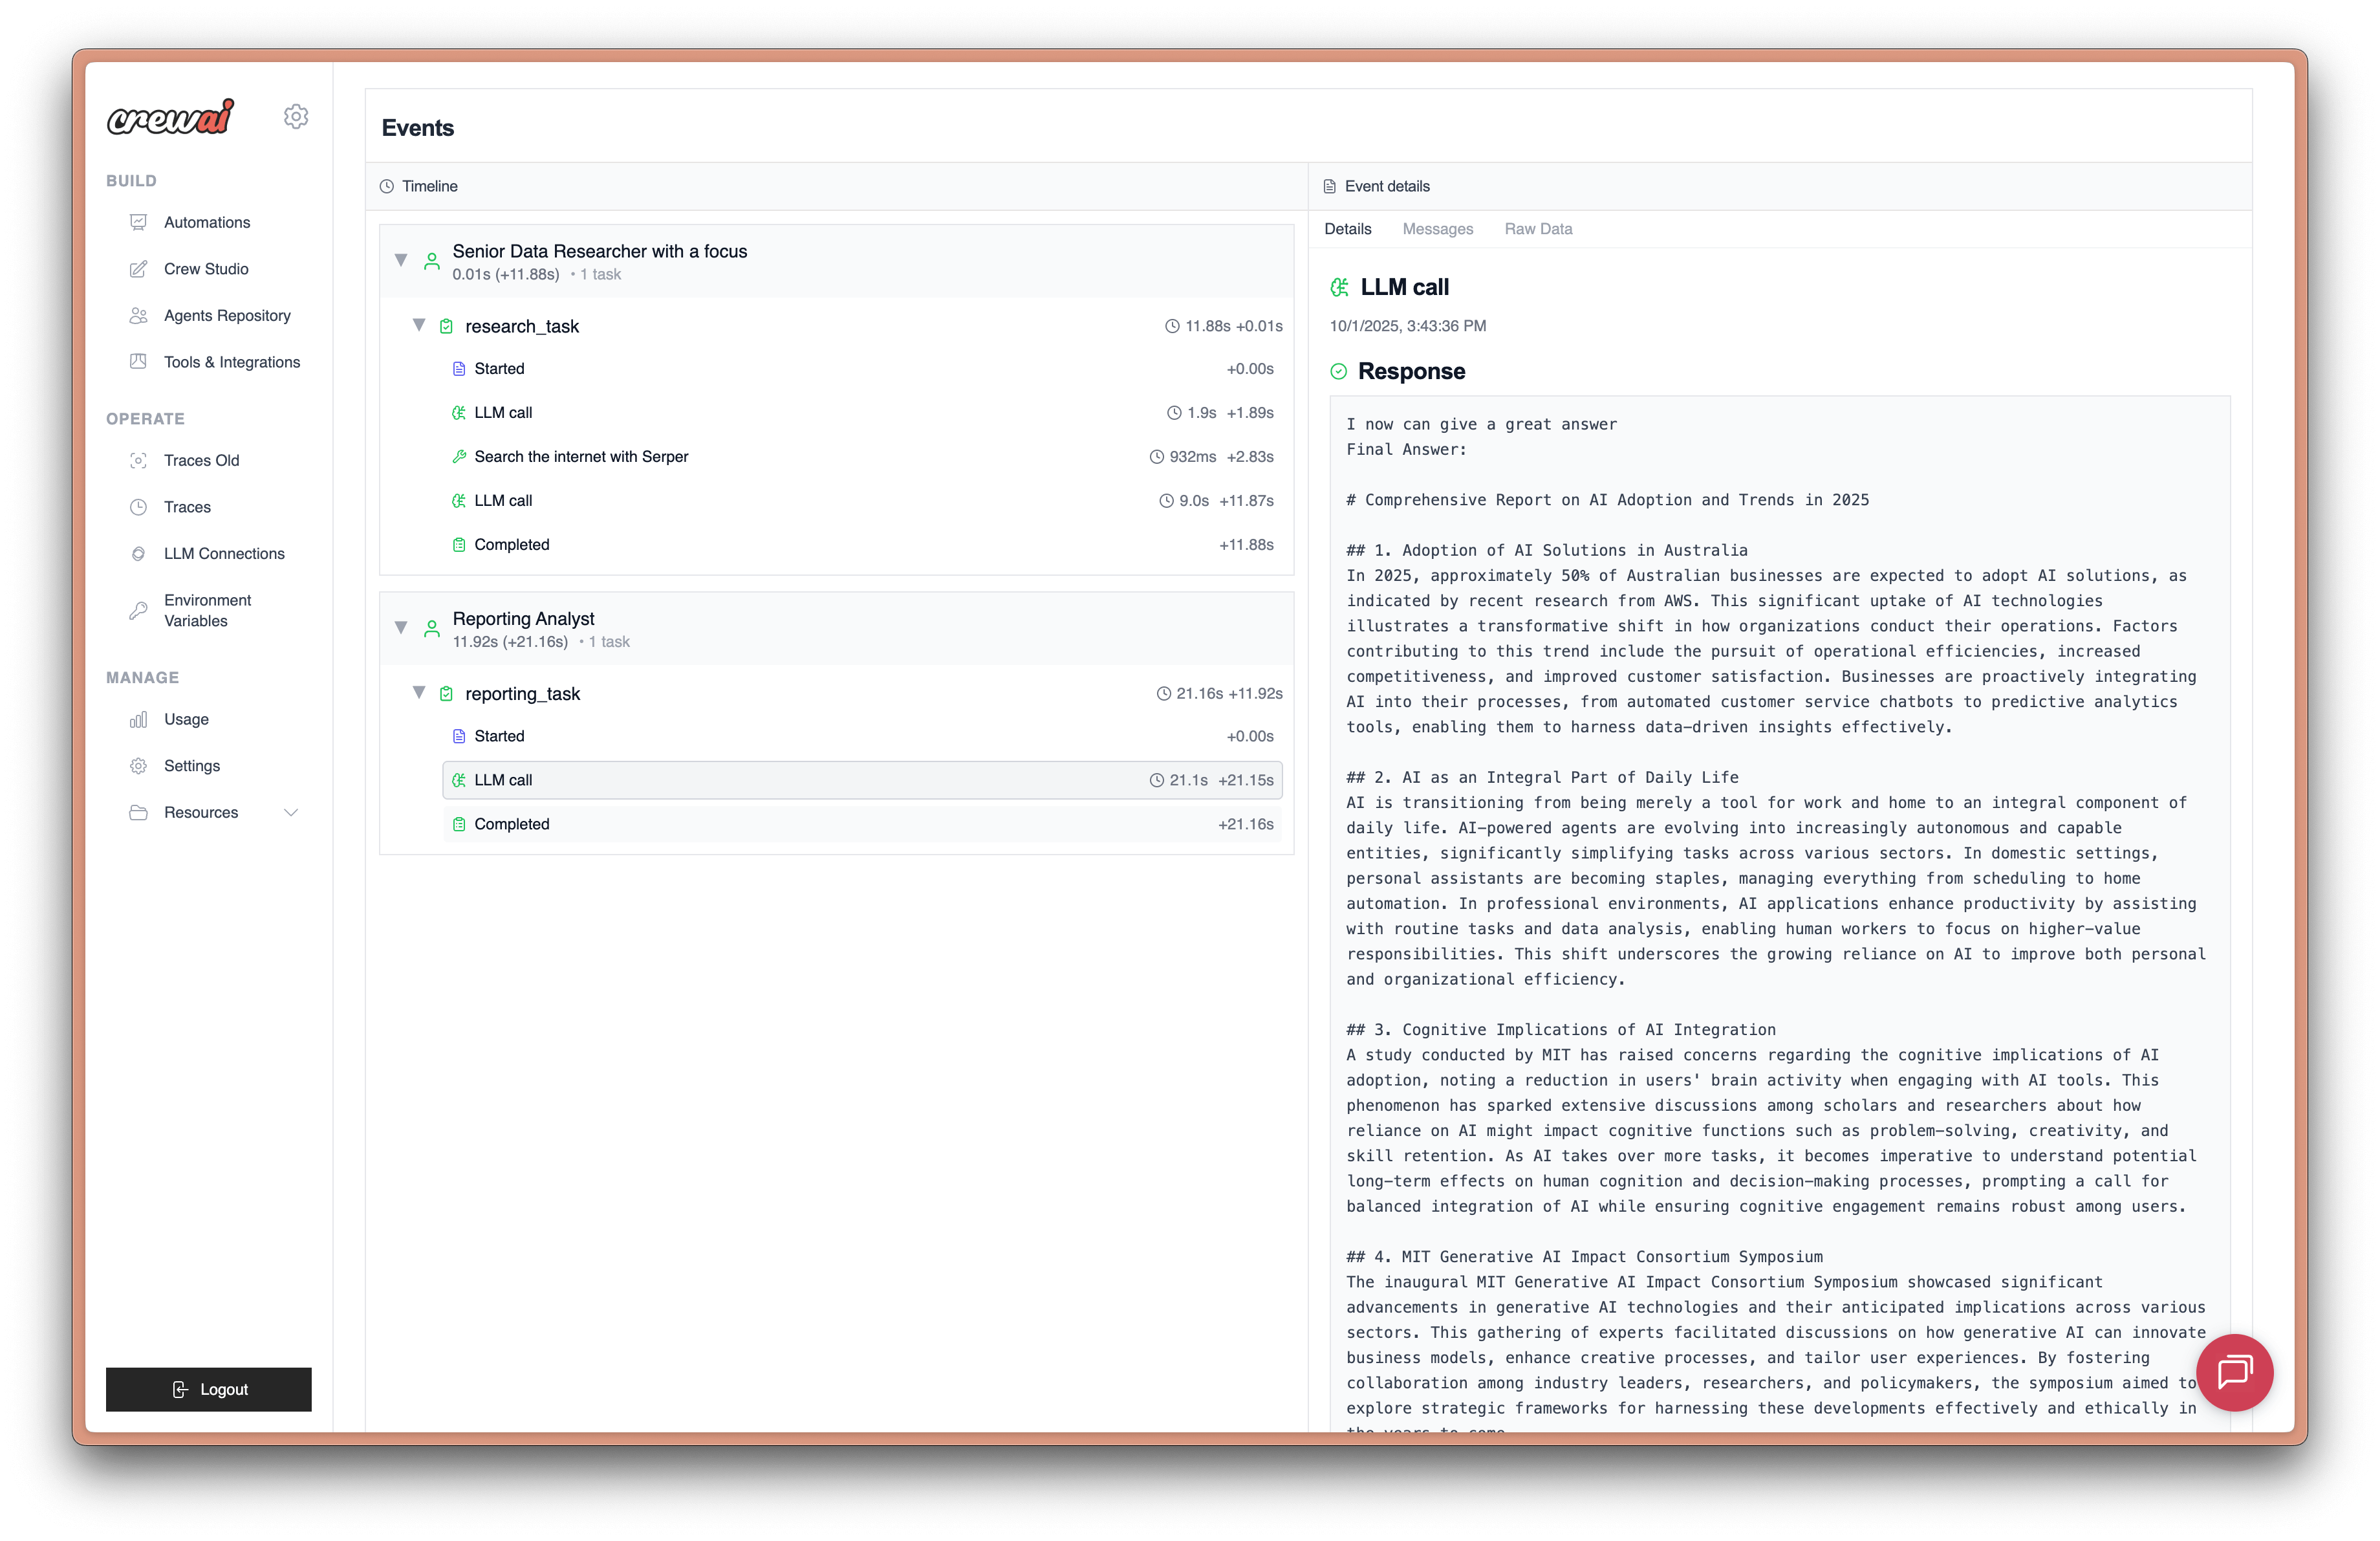
What You’ll See in Traces
CrewAI tracing provides comprehensive visibility into:- Agent Decisions: See how agents reason through tasks and make decisions
- Task Execution Timeline: Visual representation of task sequences and dependencies
- Tool Usage: Monitor which tools are called and their results
- LLM Calls: Track all language model interactions, including prompts and responses
- Performance Metrics: Execution times, token usage, and costs
- Error Tracking: Detailed error information and stack traces
Trace Features
- Execution Timeline: Click through different stages of execution
- Detailed Logs: Access comprehensive logs for debugging
- Performance Analytics: Analyze execution patterns and optimize performance
- Export Capabilities: Download traces for further analysis
Authentication Issues
If you encounter authentication problems:- Ensure you’re logged in:
crewai login - Check your internet connection
- Verify your account at app.crewai.com
Traces Not Appearing
If traces aren’t showing up in the dashboard:- Confirm
tracing=Trueis set in your Crew/Flow - Check that
CREWAI_TRACING_ENABLED=trueif using environment variables - For authenticated export, verify your CLI login,
CREWAI_USER_PAT, or platform integration credential. For anonymous sharing, explicitly approve the consent prompt; login is not required - Verify your crew/flow executed and the trace export succeeded. Declining consent, timing out, or running without an interactive consent prompt discards the local buffer without uploading it